Hedger Pro Review – Automated Betting & Research Tools
Quick Summary
Introduction
Welcome to my Hedger Pro review! I’ve been testing out this horse racing betting platform, which offers visual tools for analysing races and even lets you automate betting systems.
The service is run by experienced bettors Ryan Phillips and Nigel Dove, who you may recognise from another betting service called Exponential Bet.
Central to the Hedger Pro offering is the Research tool, whereby users can backtest the performance of various backing or laying theories. This review will primarily focus on exploring this tool.
Many of the Hedger Pro research filters are different from the standard ones seen within other horse racing system builders.
One of the big advantages with Hedger Pro is that users can automate their systems by linking their Betfair Exchange account. The software is approved and certified by the Betfair security team and passes all API requirements, per the Hedger Pro website.
Additionally, Hedger Pro offers daily race cards which are customisable to include the criteria you see as most relevant. This ties in with the research tool as form metrics displayed on the race cards are the same ones which are used to test and build systems.
During my research, I uncovered a system that showed an impressive 238 points profit with a 9.5% yield across 2,516 bets.
I’ll explain how it came together in this review.
Hedger Pro Review Video
Hedger Pro Research Tool
The Research Tool is Hedger Pro’s cornerstone, empowering users to build profitable betting systems. The tool uses graphical analysis including charts and tables to visually represent the profitability of a system.
This helps users refine a system and quickly identify adjustments.
Below, I will walk you through the process of building and refining a system, with the goal of producing a logical, profitable backing system.
Firstly, I will choose which filters I want to research by selecting them. They will then be highlighted in green as below:
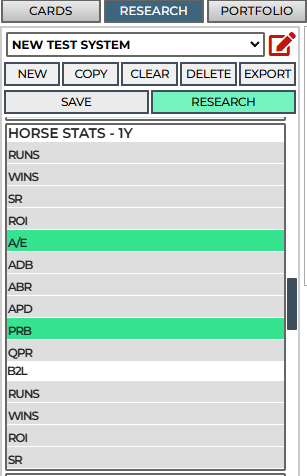
I have chosen the A/E and PRB filters for horse stats, as well as a few other filters based on odds and trainer stats. For clarity, here is a description of these form stats:
A/E (Actual vs. Expected)
A/E stands for “Actual versus Expected.” It’s a key performance indicator (KPI) that helps you understand whether a horse (or jockey/trainer) is performing better or worse than expected based on their odds. It’s calculated by looking at the total expected wins against actual bets won.
A/E > 100%: This is desirable. It indicates that the horse (or jockey/trainer) is winning more often than their odds suggest they should. This could signal value.
A/E < 100%: This means the horse (or jockey/trainer) is winning less often than their odds suggest. They are underperforming.
PRB (Percentage Rivals Beaten)
PRB stands for “Percentage Rivals Beaten.” It represents the average percentage of other horses the runner has beaten in its races during the specified period (typically 12 months for horses). It indicates how competitive the horse is within a field.
In essence, it reflects the horse’s ability to outperform its competition. A higher PRB generally suggests a more consistent and competitive horse.
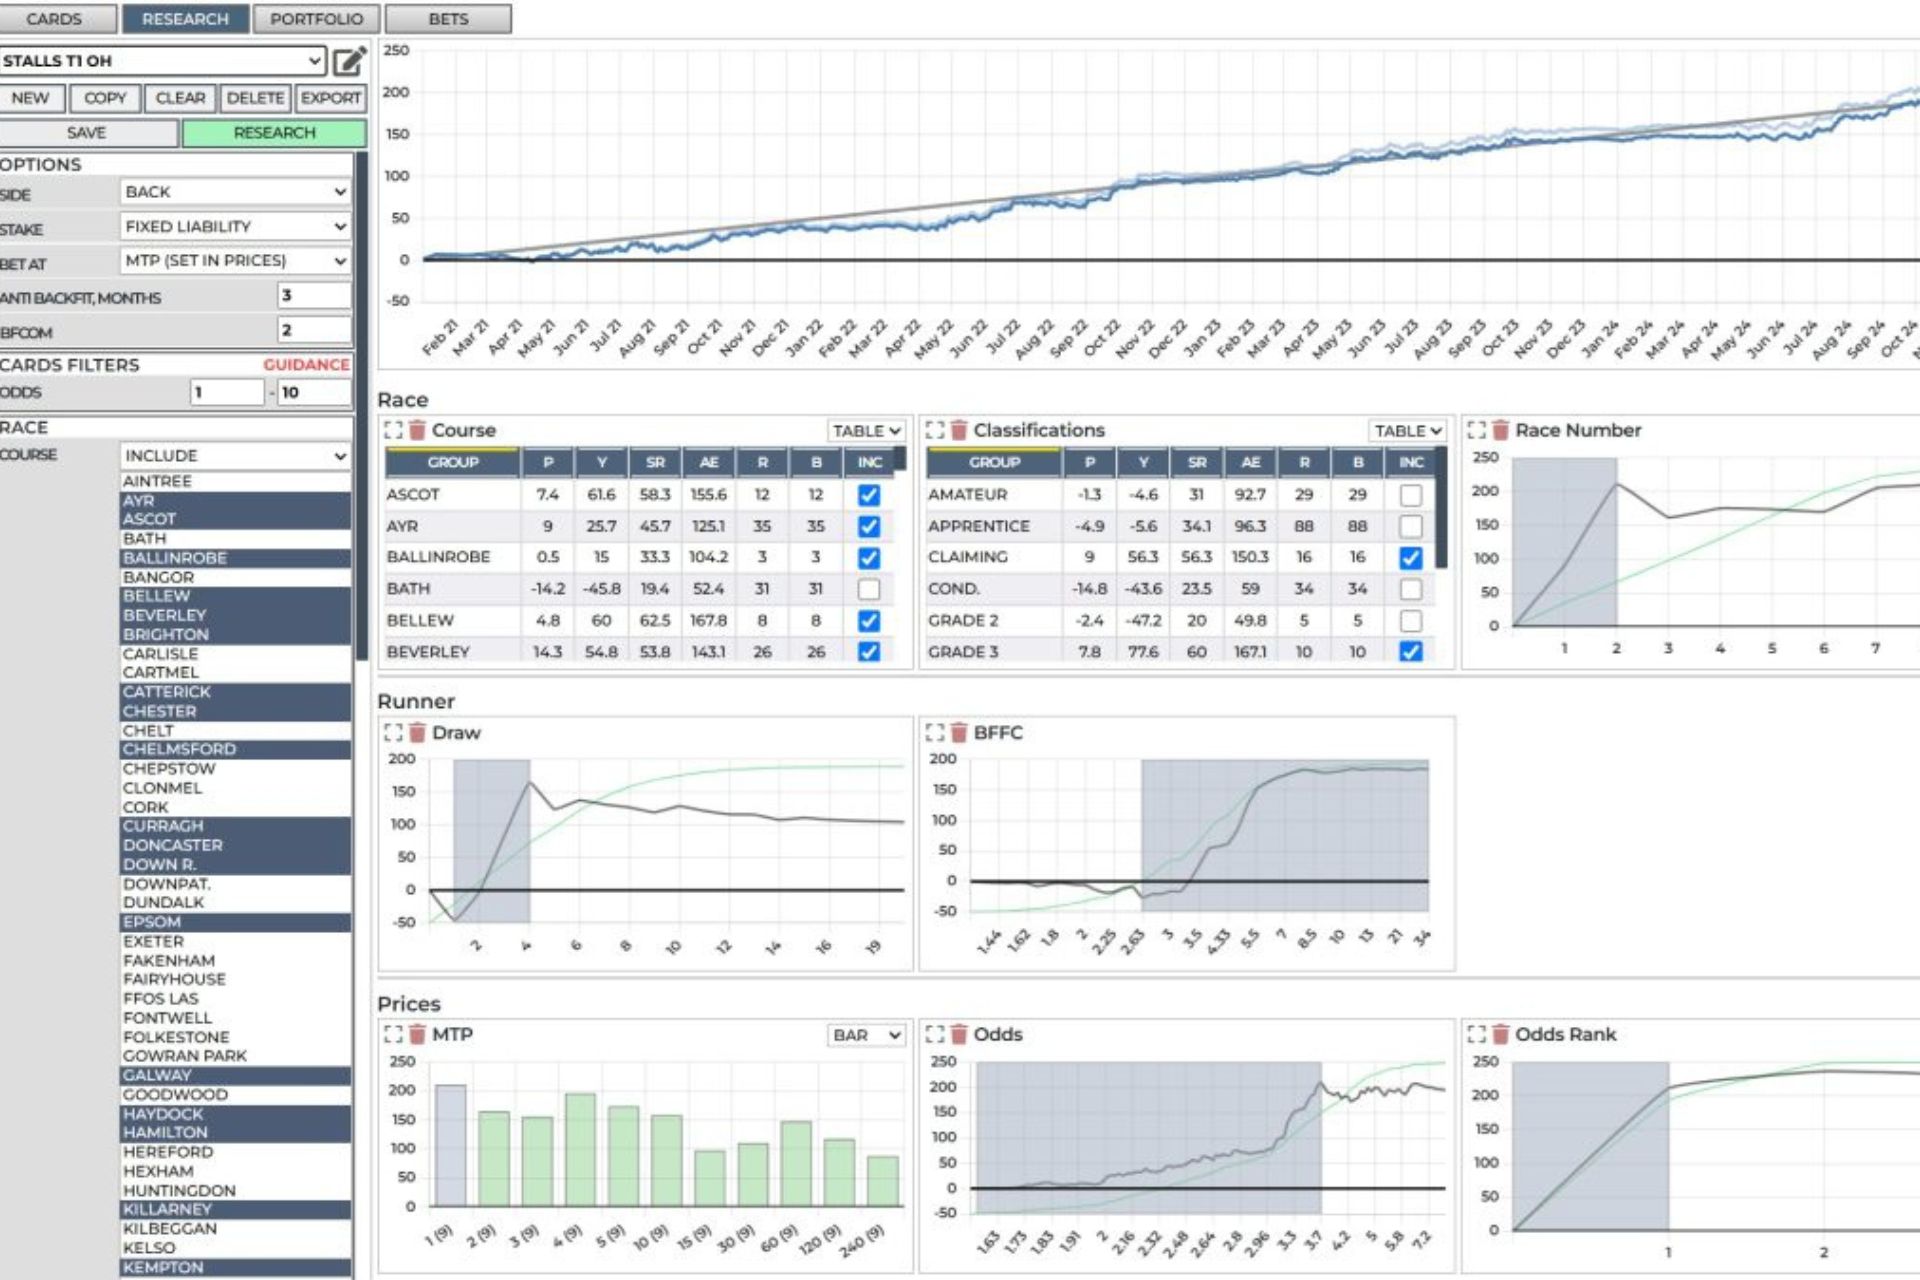
Having chosen our filters, we are taken to the main research page where we create the system based on these filters. This is what this page looks like:
The interface shows all values on the left as 0 because I have not put in any data yet. As such, the system is showing the results from over 61,000 races.
The results are shown on the right-hand side.
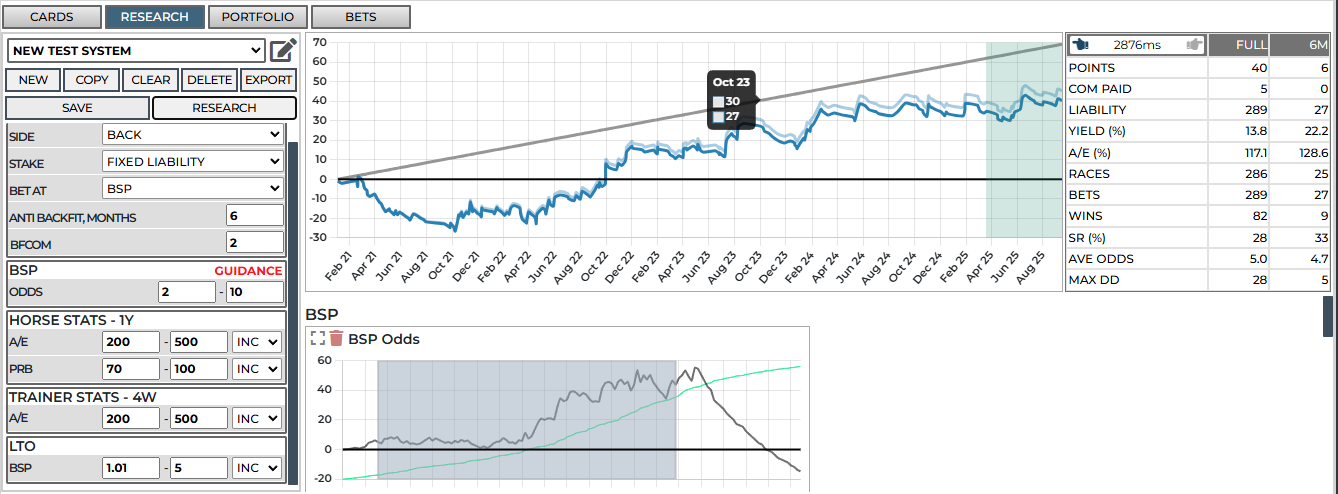
Now I will specify the rules.
Central to this system is the A/E and PRB figures. I am targeting horses which are above average in those stats, as well as a trainer with strong A/E stats.
Additionally, I have set an odds range between 2.00 and 10.00, and the Last Time Out (LTO) BSP between 1.01 and 5.00.
I am wanting to target horses near the front of the market who were also favoured in their previous race. I have set the system to bet at BSP.
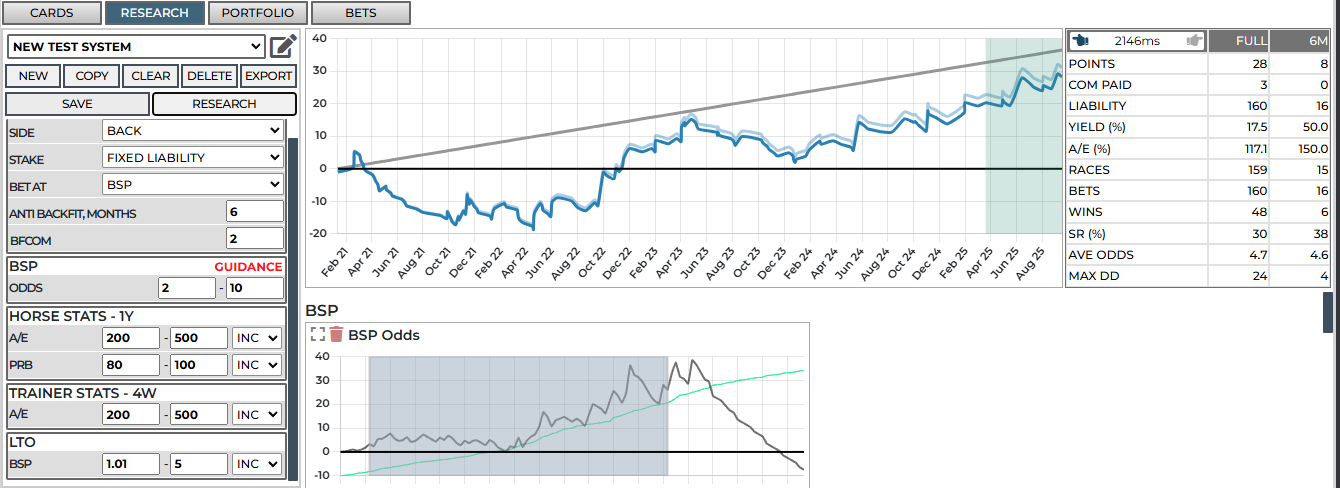
The results on the right-hand side from the above screenshot show the system has produced 28 points profit all-time, with a yield of 17.5% from 160 bets.
This is a great start, but the sample size is too low.
I will adjust the PRB range down to 70-100. This almost doubles the sample size whilst maintaining a strong yield of 13.8%.
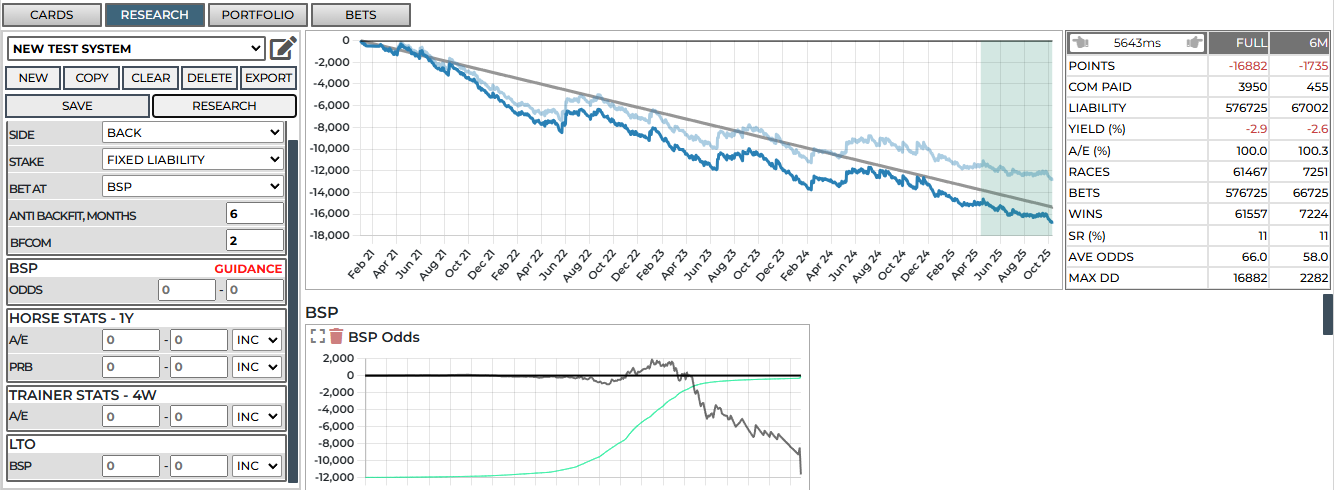
Next, I will significantly expand the odds range to see how the system performs across all odds.
I set an odds range between 1.5 and 100.
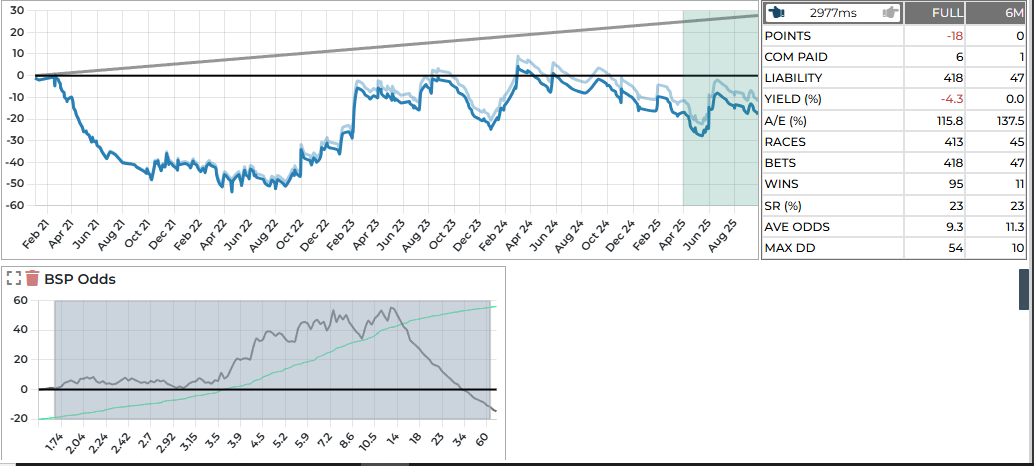
This now produces a loss of 18 points, with a yield of -4.3%.
We can see from the BSP odds graph where the damage is occurring. The graph nosedives at odds greater than 14.
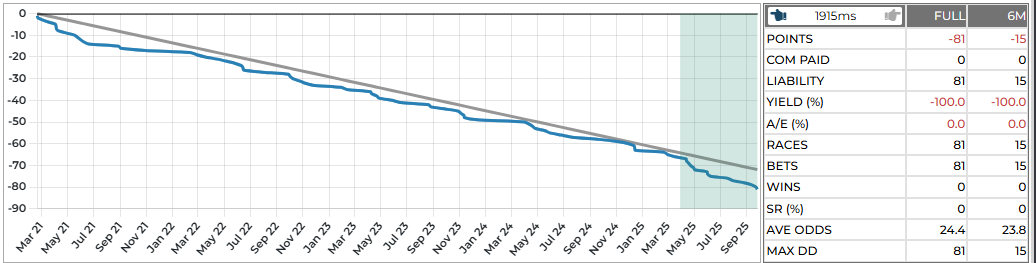
If we isolate these bets, we see that all 81 bets at odds greater than 14.00 have lost!
So, I decide to adjust the odds range to 2.00 – 15.00. The system now produces 43 points profit with a 12.5% yield from 343 bets.
Let’s take a closer look at the A/E and PRB graphs.
The dark highlighted areas are the specified range for this system.
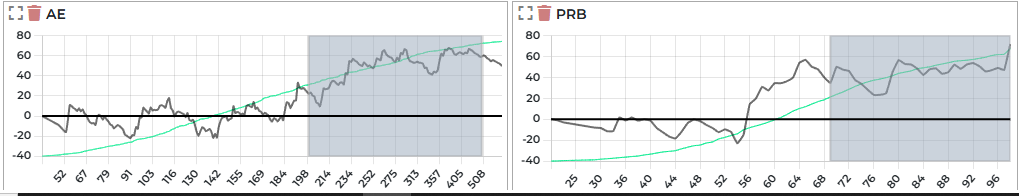
I appear to have set a good range for the A/E, with most of the profit coming from the 200-500 range.
However, it is clear that the PRB is producing a significant profit in the 50-70 range, where my rules specify a range of 70-100.
I will widen the range to 50-100 and update the system.
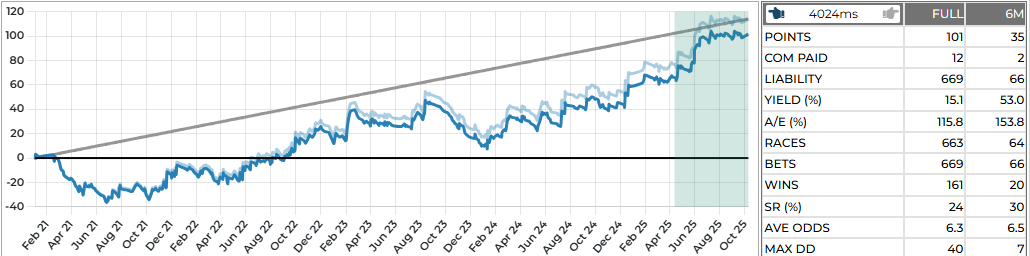
Great! Now this system is showing 101 points profit at a 15.1% yield from 669 bets.
I’ll now look at the graph for the LTO BSP. I have this odds range set at 1.01 – 5.00.
I notice that most of the profit comes when the LTO BSP was greater than 5.
As such, I will remove this rule entirely as my initial idea of focusing on horses favoured in the market in their last start appears to be unfounded.
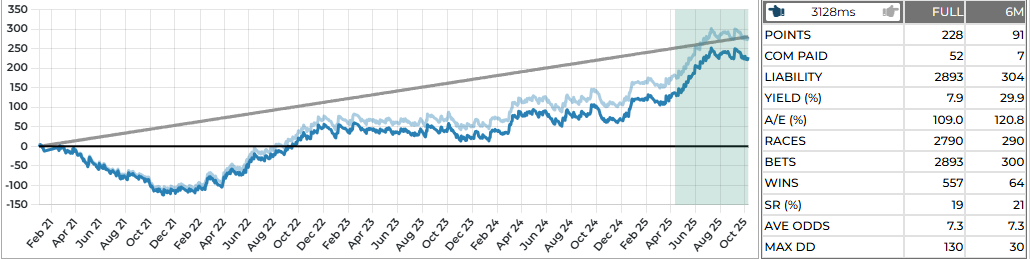
Wow! Now, we have a system producing 228 points profit from 2893 bets.
The yield has dropped to 7.9%, but I am much happier with this system than the original one with only 160 bets.
We could circle back to the odds range to try and improve the yield. You can see from the BSP graph below that the system essentially treads water below odds of 3.65.
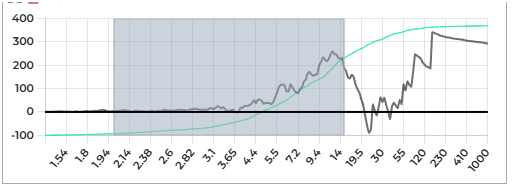
Therefore, I will adjust the odds range to 3.50 – 15.
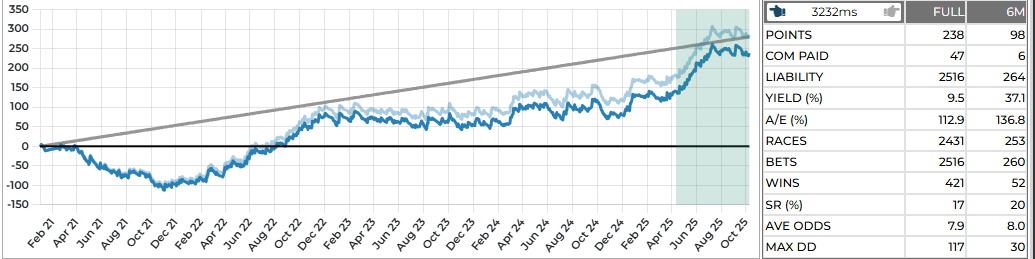
That has increased the yield to 9.5%, removing only a few hundred bets.
We have what looks to be a robust system, now. We have arrived at this final system by making logical tweaks based on the data displayed in the charts. There is always a level of common sense required to ensure you are using logical system filters.
For example, we can add a course filter which shows the profit or loss achieved at each course.
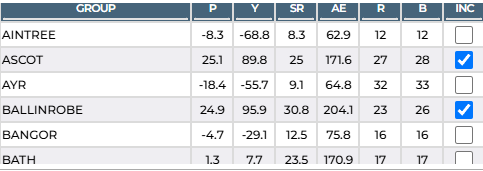
If I work down the list and select all systems showing at least a 10-point profit at the course, here is how our system performs:
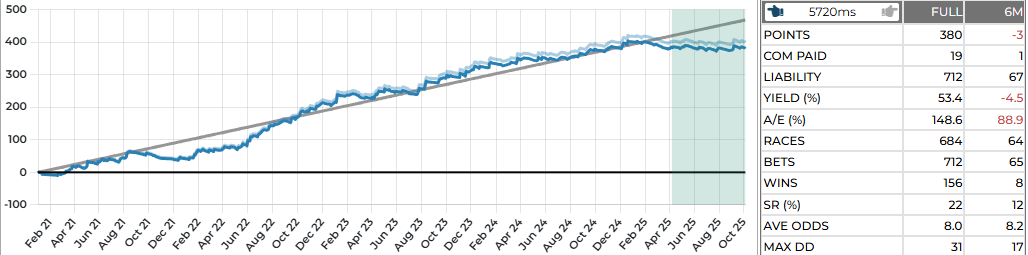
We now have 380 points profit at 53.4% yield!
However, I think we can all see that this is simply cherry-picking courses which have performed well over a small sample. I would want to see a few hundred bets at a course before drawing any conclusions.
The most bets at any course for this system was 100, so I would not look to make any course specific additions to this system.
Hopefully, this has demonstrated the process of having a theory and refining it to produce a robust system using the Hedger Pro Research Tool.
Any of these systems can be automated on Betfair Exchange through the Portfolio Manager.
Minutes to Post (MTP)
You can also backtest a system based on betting into the live Betfair market using the MTP filter.
This offers an interesting alternative to simply betting at BSP. There are several MTP intervals you can choose, starting at 240 minutes from scheduled start down to 1 minute from the off.
Unique Research Metrics
Hedger Pro stands out by offering unique metrics for analysing horse racing performance, setting it apart from other similar services.
Here, I’ll highlight three innovative metrics: Quality Performance Rating (QPR), Average Book Reduction (ABR) and Average Price Drop (APD).
Quality Performance Rating (QPR)
QPR is an AI-generated rating that combines stats known to have a good effect on in-running performance.
It gives you a single number reflecting the overall quality and potential of a horse, jockey or trainer. It considers several factors to provide a comprehensive assessment.
Average Book Reduction (ABD)
ABR represents the average reduction in the implied probability of the Betfair market book during a race. It’s calculated as the difference between the starting book percentage and the lowest book percentage observed in-play.
A higher ABR suggests that the horse’s chances improved significantly during the race according to the market.
Example:
Starting odds = 10, In-play low = 2.
Formula: 100/2 – 100/10 = 50 – 10 = 40%
Average Price Drop (APD)
APD measures the average difference between a horse’s Betfair Starting Price (BSP) and its lowest in-play price (IPL). It indicates how much the horse’s odds decreased during the race, suggesting potential for in-play trading strategies.
Example:
Starting odds = 10, In-play low = 2.
Formula: 10 – 2 = 8
These metrics represent unique ways of measuring a horse’s recent form. Each one is designed to highlight horses whose recent runs have been better than what the market expected.
Hedger Pro Racecards
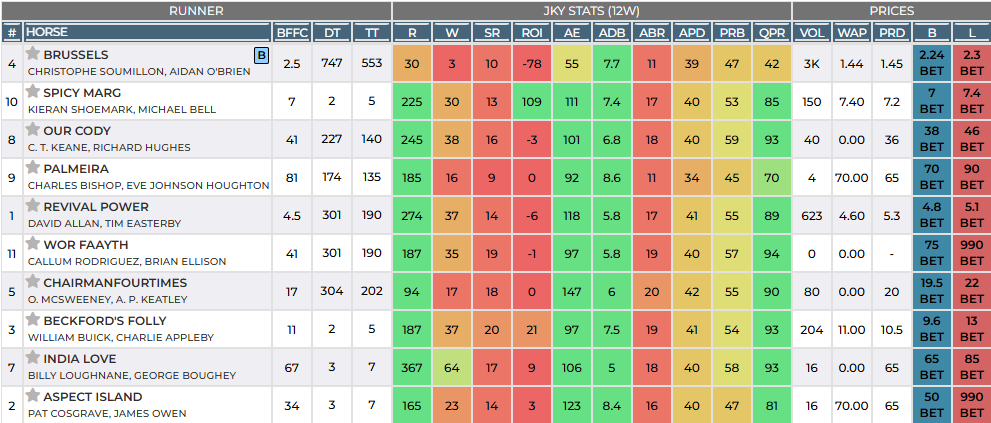
The Race Cards display all the information available to analyse within the Research Tool. They are fully customisable for each user and are colour coded to identify strong horses at a glance.
Here is the view of an upcoming race from Newmarket:
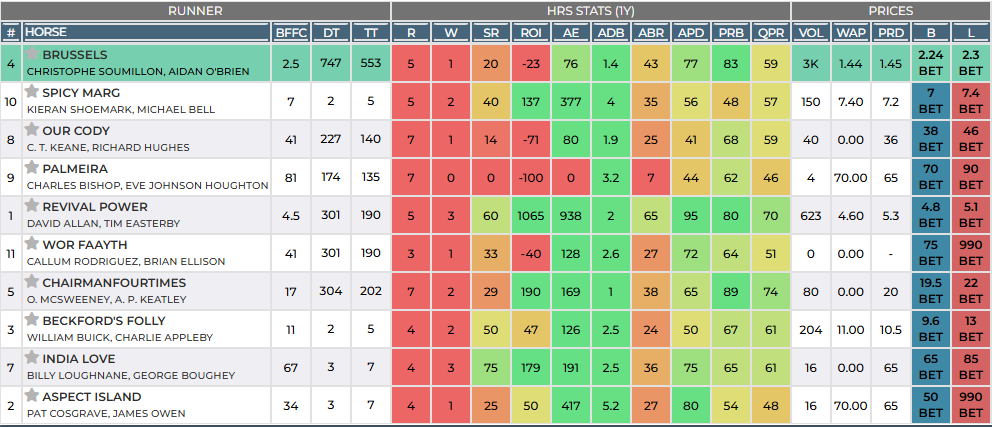
At first glance, it is quite overwhelming. Helpfully, a description is displayed when you hover over the various acronyms, making them easy to decipher initially.
As mentioned, a great aspect of the Hedger Pro racecards is the ability to customise them to show the information you consider relevant.
You will notice in the above screenshot that all the form stats are for the horse (Hrs Stats 1Y). You can also add trainer and jockey metrics.
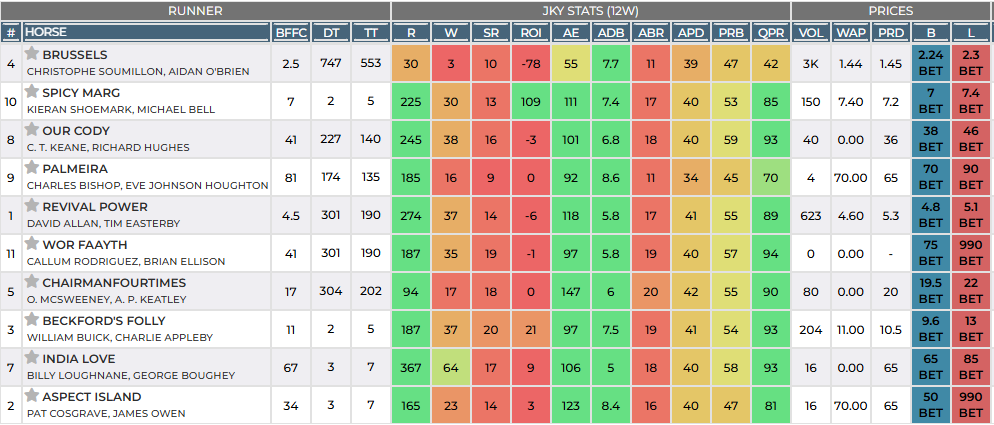
Here I have included only jockey stats:
I mentioned earlier that users can connect their Betfair Exchange account directly into their Hedger Pro account. Once the account is connected, it enables you to place bets directly from these racecards by clicking on the back or lay odds displayed on the right-hand side.
This pulls up a screen to submit your bet.
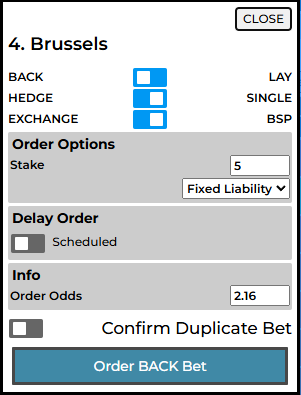
Here, I am submitting a £5 back bet on Brussels, placed at BSP.
The racecard will then update with a ‘B’ next to the horse’s name to reflect a back bet has been placed on my Betfair account.
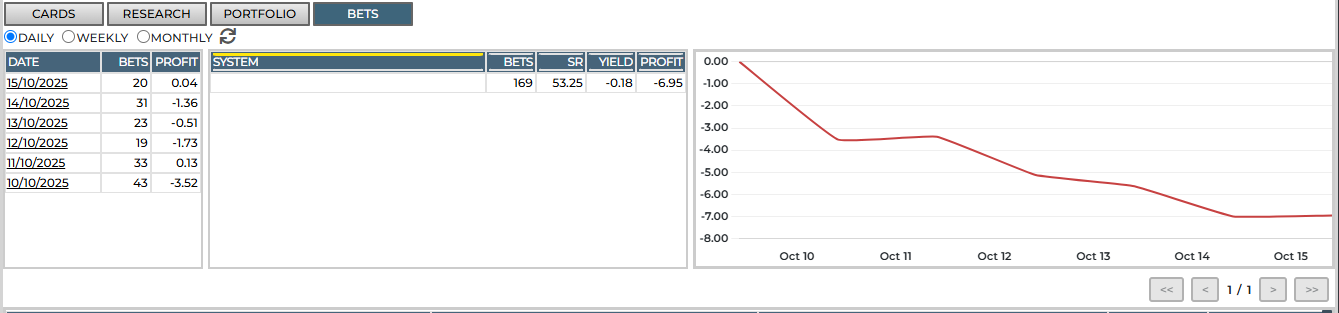
All bets are then recorded on the Bets screen, and can be sorted by day, week or month. Users can also export their betting history to excel for further analysis.
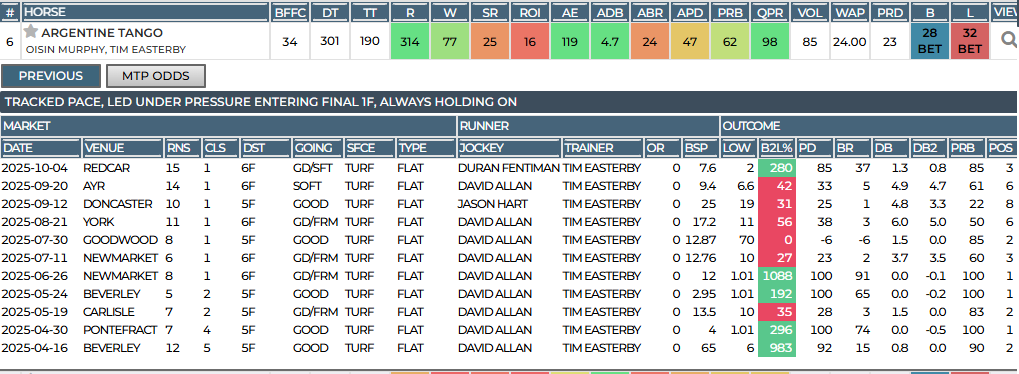
Back to the race cards, and you also have the ability to dig further into a horse’s recent form as seen below.
Further, you can see the odds it has traded at various MTP intervals in today’s race by toggling to ‘MTP Odds’.
Customer Support
The quality of customer support is often a credible indicator to the quality of the overall service.
This is true of any business but particularly with betting tipsters given the prevalence of disingenuous operators. In this regard, Ryan deserves a lot of plaudits for the effort he puts into communicating with his subscribers, both personally and in the Telegram channel available for all members.
Ryan has always been very quick to reply to any questions I had and consistently helpful and detailed in his response. Additionally, he commits a lot of time to engaging with members in the Telegram channel.
He is clearly committed to helping users understand the service and get the most out of it.
Beyond personal support, Hedger Pro has an AI chatbot which is trained to understand the user manual and answer any questions based on that information.
I have found this to be highly useful and another positive indication of the effort put into helping users understand the service. The descriptions of the various form metrics throughout this review were generated by this bot.
Other Considerations
The one downside to the Hedger Pro service is that it will take longer than usual to fully understand what the various parts of the service are doing and how to best use them.
The different form metrics will take some time to understand, as will the practicalities of using the Research Tool and interpreting the graphs. It definitely took me longer than with other services to feel confident using it.
With that said, a full user manual is provided and as mentioned above, Ryan is very dedicated to helping members navigate the service and get the most out of it. It just should be noted that there will be some more time involved with getting used to Hedger Pro than with other similar services.
I will also note that, as Hedger Pro is not a traditional tipster service, the experience of each user will vary. Some people will be able to build systems and use the information within Hedger Pro more successfully than others.
These are all things to be aware of when starting out with the service.
Get 5% Off Hedger Pro
Use coupon code RT
Final Verdict
Hedger Pro, created by Ryan Phillips and Nigel Dove, offers a unique platform for horse racing enthusiasts. Its innovative form metrics enable users to test system ideas unavailable elsewhere.
The Research Tool simplifies the process of building profitable systems. The site is functionally excellent, with fast loading times and an intuitive interface. Backed by excellent customer support and Betfair integration, Hedger Pro empowers users to create data-driven betting systems.
I am therefore very happy to recommend Hedger Pro.
Get 5% off your membership with code RT – click here.
Justin Ellis
With years of experience making a living from professional betting, he also produces content across a wide range of sports and racing.