
Affiliate disclosure: This review contains affiliate links. If you sign up through one of these links, we receive a commission at no extra cost to you. This does not affect our review or verdict.
TRIAL OVERVIEW
Quick Summary
Introduction
Inform Racing is a long-established horse racing service offering both daily tips and a range of research tools, including Daily Race Cards and a System Builder.
In this review, I’ll be looking at both sides of the service, starting with the Daily Tips, which have produced a healthy profit to Betfair Starting Price (BSP) since launching at the beginning of 2024.
Inform Racing has been run by Ian Welch since 2003, making it one of the longest-running horse racing websites of its kind.
A key part of the service is Ian’s daily speed ratings, which can be used alongside the System Builder to research races, test ideas and create your own betting systems.
For those who prefer a more straightforward approach, Inform Racing also provides a daily list of selections to follow.
Inform Racing Video Review
Inform Racing Daily Tips
On average there are 2-3 tips per day. The selections are posted on the site’s noticeboard each morning, available to all members. There is no official staking advice, but the bets are recorded as level stake win bets to BSP.
Let’s start with the advertised stats, up to June 15, 2025. The results are to BSP after the standard 2% commission is deducted.
Advertised Stats
Based on £10 stakes
Profit
Strike Rate
ROI
Bank Growth
These are some seriously impressive numbers over just 18 months, particularly when you consider the results are measured against Betfair Starting Price, one of the strongest benchmarks available in horse racing.
Here is how the performance looks on a graph, to £10 level stakes:
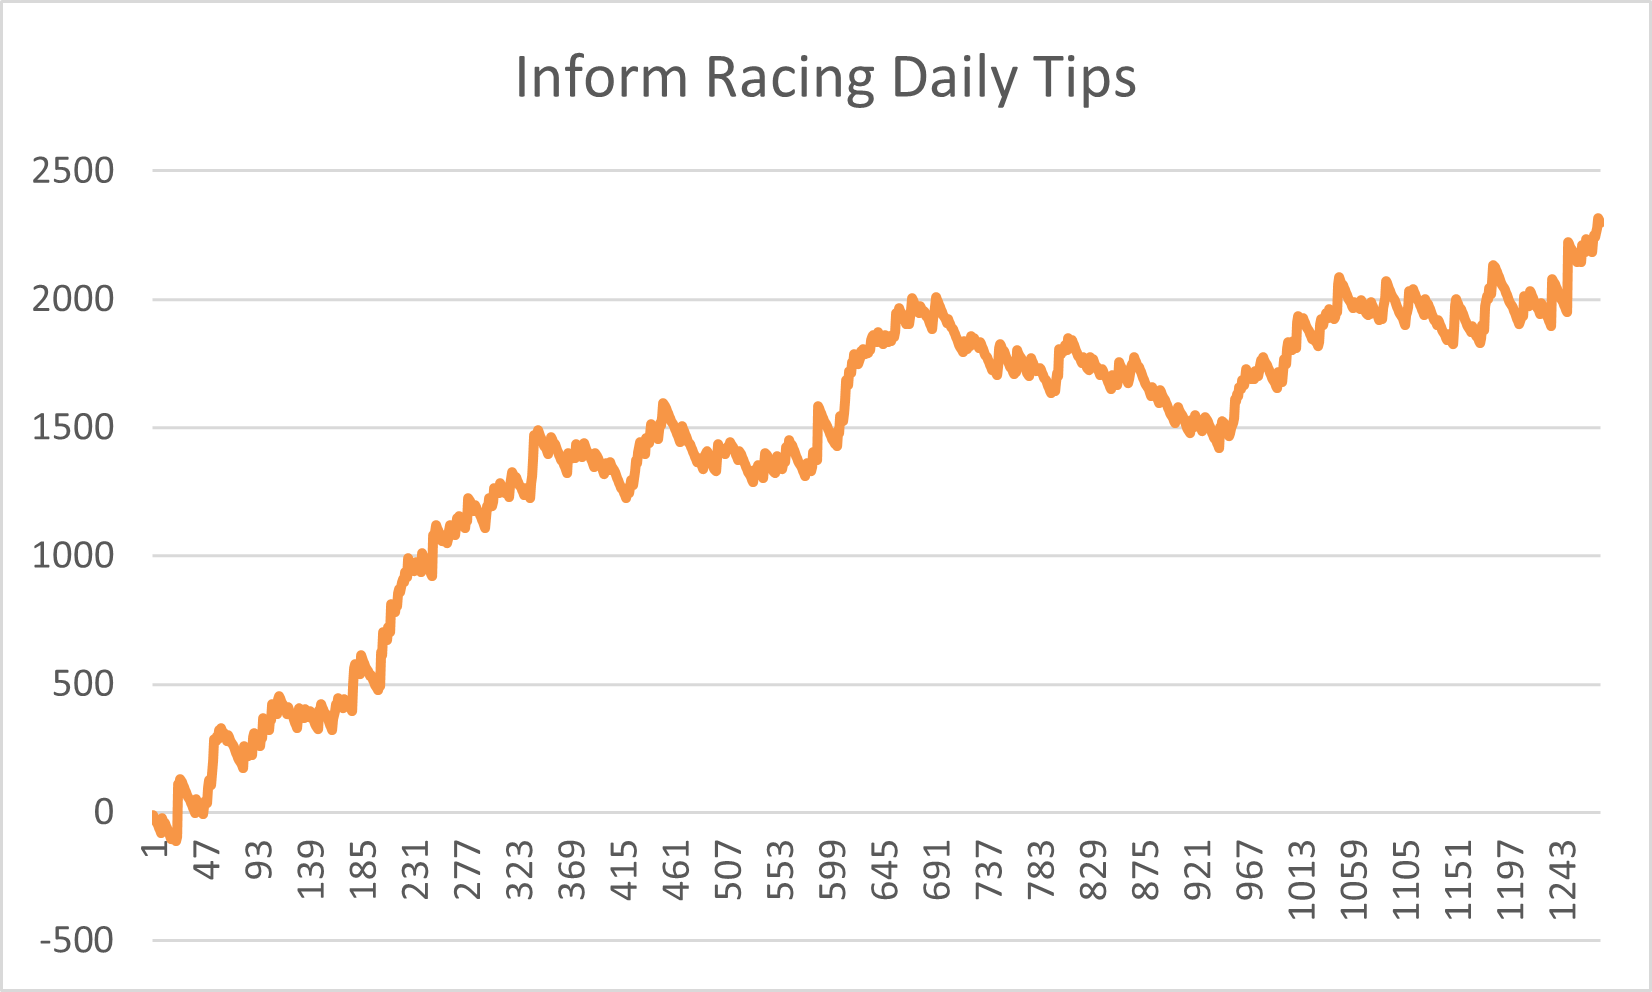
This is the sort of graph I love to see, as it illustrates that profit has been produced steadily, and not as the result of a longshot winner or one hot spell.
Bank Growth
There is no official staking or bankroll advice provided by Inform Racing for these selections, although results are recorded as level stake win bets in this spreadsheet updated daily.
The largest drawdown to date reached 58.80 points.
As a rough guide, I like to allow a betting bank of at least twice the largest historical drawdown. On that basis, a 150-point bank feels appropriate for these selections.
I would consider a 100-point bank aggressive, and a 200-point bank conservative.
Below are the Return on Capital (ROC) figures for each of these options:
Performance By Odds Range
Let’s breakdown the performance by odds range:
| Bank Size | ROC |
| 100 points | 229.7% |
| 150 points (Recommended) | 153.14% |
| 200 points | 114.85% |
There’s a clear trend in these results, with the strongest ROI coming from the higher odds ranges. The bulk of the profit from these selections comes at the odds range of 4.51 – 10.00.
Let’s then breakdown the performance into those two odds ranges for simplicity:
| Odds Range | Bets | ROI | P/L (Points) |
| Up to 3.00 | 157 | -0.08% | -0.12 |
| 3.01 to 4.50 | 280 | 3.23% | 9.34 |
| 4.51 to 7.00 | 446 | 13.9% | 61.99 |
| 7.01 to 10.00 | 196 | 63.89% | 125.23 |
| 10.01 to 15.00 | 102 | 20.65% | 21.06 |
| Over 15.01 | 96 | 13.03% | 12.51 |
| Total | 1,277 | 17.99% | 229.70 |
This nicely demonstrates what we are seeing here.
The obvious question is whether to only bet on the selections above 4.50. However, I would need to see at least another 500 bets from the odds band below 4.50 before considering this.
Whilst low compared to the other odds ranges, an ROI of 2.04% is nothing to be concerned about at this stage.
Keeping the shorter-priced selections in the portfolio should also help reduce some of the volatility that comes with relying more heavily on bigger-priced winners.
Advanced Statistics
Let’s now look at two advanced statistics which provide an indicator of whether the results have been achieved through luck or skill.
Archie Score: 5.9 (1.5% chance it was achieved through luck)
P- Value: 0.005 (0.5% chance it was achieved through luck)
A P-Value below 1% is considered strong evidence the returns are not the result of chance or luck.
Both figures provide encouraging statistical evidence that the historical results are unlikely to be explained by random chance alone. That supports what we’ve seen elsewhere in the results, although naturally it doesn’t guarantee that the same level of performance will continue in the future.
Additional Tips
There are also daily selections called the SRS Ratings, which produce a bet for each race by identifying the horse with the strongest combined score from the chosen speed ratings.
These are available via a daily excel spreadsheet for members, although the advertised results only span a three-month period between 2017 and 2018 for some reason.
I tracked the SRS Daily selections for three months, beginning on June 16 and ending on August 17. Prices were taken in the live Betfair market in the minute before race start time and 1321 bets were placed.
Unfortunately, the selections did not produce a profit in this period.
Here are the results, before commission is deducted.
| Odds Range | Bets | Wins | Strike Rate | P/L | ROI | Avg. Odds |
| All bets | 1,321 | 234 | 17.71% | -47.69 | -3.61% | 6.63 |
These results are obviously not good, but also not terrible for a rules-based system which produces a bet in every race. Based on my test, simply backing every SRS selection wasn’t profitable.
However, filtering the selections by odds range does show a potential angle in. Results again shown before commission is deducted:
| Odds Range | Bets | Wins | Strike Rate | P/L | ROI | Avg. Odds |
| 1.01 to 6.00 | 641 | 164 | 25.59% | 42.36 | 6.61% | 4.28 |
| 6.01+ | 680 | 70 | 10.29% | -90.05 | -13.24% | 8.83 |
| All bets | 1,321 | 234 | 17.71% | -47.69 | -3.61% | 6.63 |
We see that bets at the front end of the market have performed exceptionally well. This split could be attributed to not having a large enough sample size, but it is interesting to note.
At the very least, the SRS selections under 6.00 could potentially be used as a shortlist alongside other systems or form analysis within Inform Racing.
Get Started
£1 for 7 Day Trial
Get 7 days of access to the Daily Tips, Race Cards and System Builder.
Inform Racing Betting Tools
Next, I’ll take a closer look at the Daily Race Cards and System Builder, including a test system built around the Inform Racing Speed Ratings.
Inform Racing Race Cards
A standard feature of any horse racing form tool is the race cards.
Here we can see the race card for the 16:00 Chepstow on June 16:
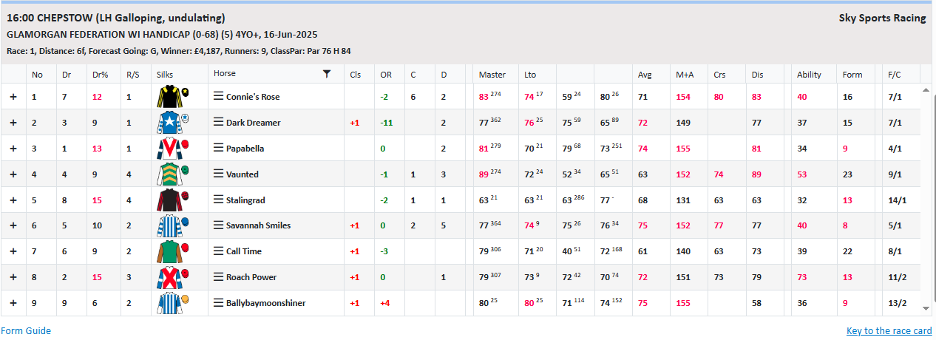
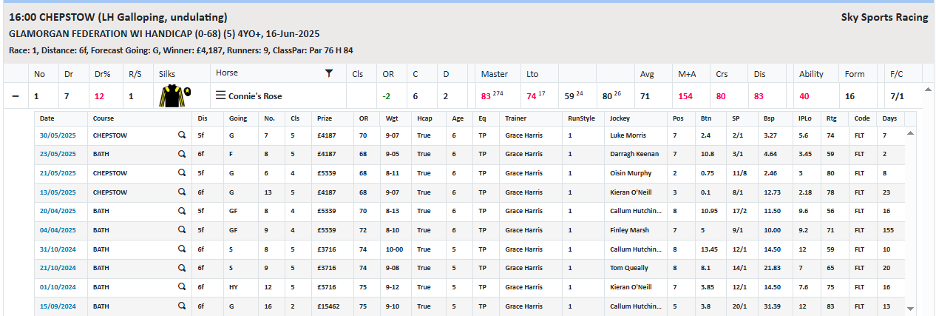
All the standard information such as number, draw and silks are present, and if we click on the dropdown button, we can see more detail on the last 10 runs of any horse:
However, the unique aspect of the Inform Racing race cards is the set of ratings. Eight ratings are provided:
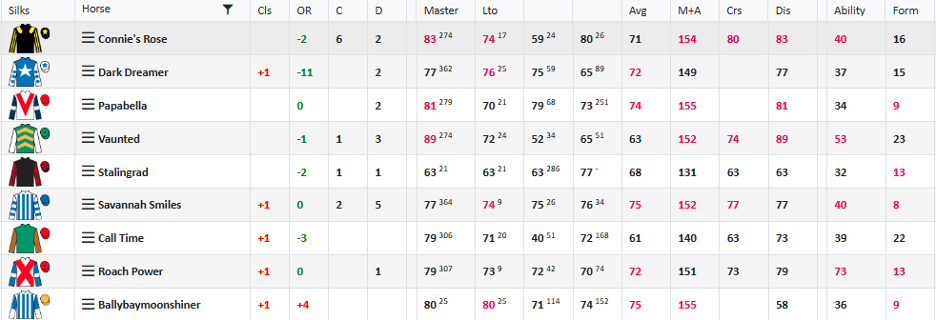
Of the ratings, I found the Master Rating particularly interesting when looking for potential betting angles. In the next section, I’ll use the Master Rating to demonstrate how the System Builder can be used to develop and analyse a potential betting system.
Also note the smaller figure above the Master Rating denotes the number of days since that race.
Generally speaking, I am more interested in a horse whose Master Rating was in the last month or two, and less interested if it was several months ago.
Another useful feature is the ability to export the entire days race cards into excel format.
Let’s say we wanted to find all horses running today with a master rating greater than 85. A few clicks in excel and there it is in an easily digestible format:
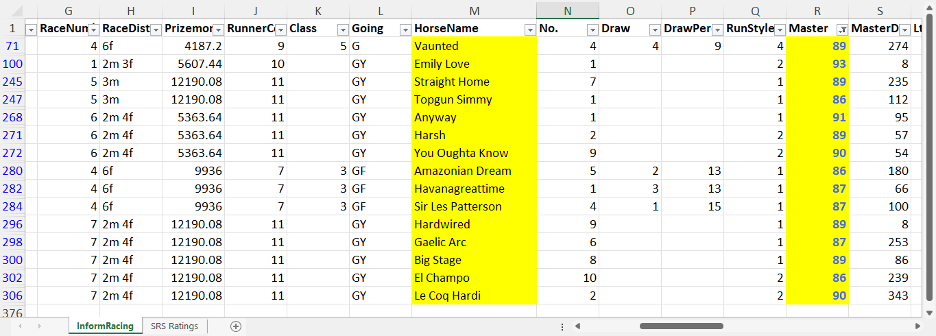
Additionally, if you click the ‘form guide’ button at the bottom of the race card, you can drill further down into each horse’s form which is useful for further analysis.
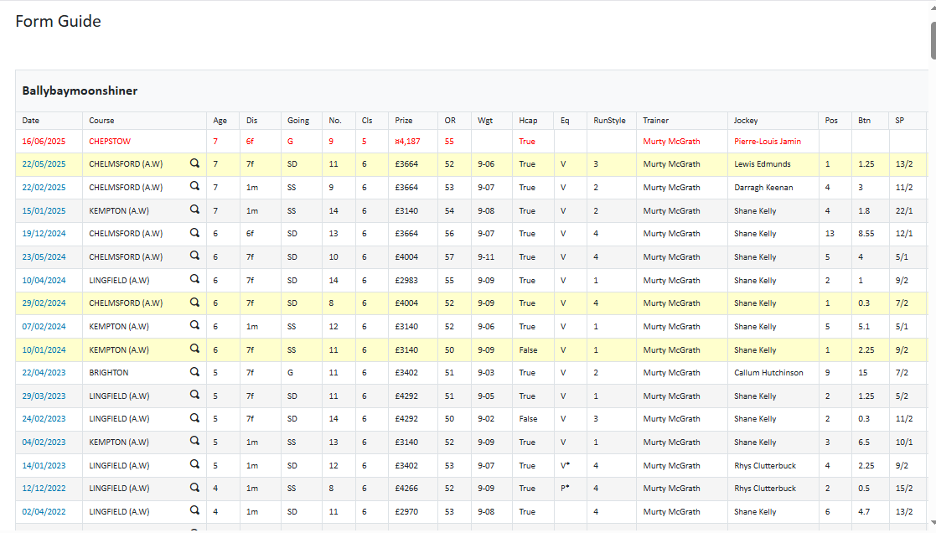
Inform Racing System Builder
Perhaps the most exciting feature of Inform Racing is the system builder.
This allows users to test their own backing or laying ideas and analyse the results to SP and BSP, with results dating back to 2015.
There are hundreds of rules and filters to choose from relating to race details, Last Time Out (LTO) form as well as horse, jockey and trainer specific form.
A unique aspect of the System Builder is the ability to test the performance for each of Inform Racing’s ratings. I created a test system to demonstrate how useful this tool can be.
My system has three rules, which you can see below, and Betfair Commission is set at 2%.
The system is centred around the Master Rating Rank (i.e. the horse with the highest Master Rating in the race).
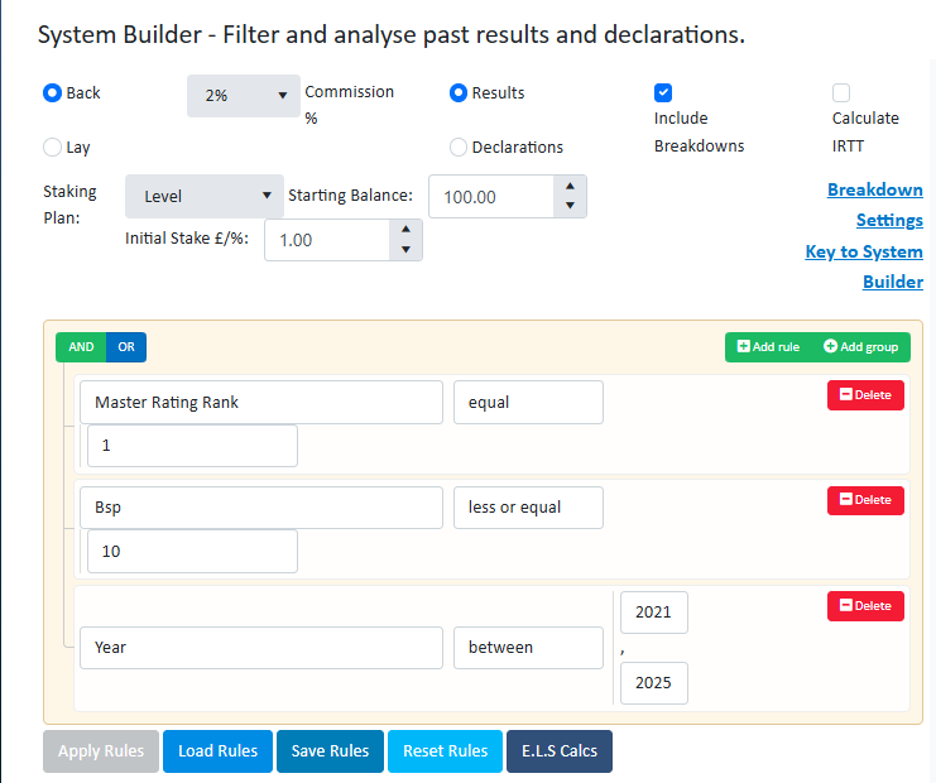
Once I have run the system, the results analysis breaks down the performance of win bets to SP and BSP, as well as place bets.
This system produces 200.62 points profit and a modest 0.56% ROI betting to win, whilst losing 351.91 points in the place market. Note the larger number of bets (36,147).
| Win Bets | Wins | P/L SP | P/L BSP | Win Streak | Lose Streak | E.L.S | E.L.S Edge |
| 36,117 | 9,794 | -2907.46 | 200.62 | 9 (1) | 28 (1) | 33.21 | 15.69% |
| Strike Rate | ROI | Min Win BSP | Max Win BSP | Avg Win BSP | Avg BSP | Chi Score | A/E |
| 27.09% | 0.56% | 1.02 | 10.00 | 3.77 | 4.90 | 2.74 | 1.01 |
| Place Bets | Places | P/L SP | P/L BSP | Place Streak | Lose Streak | E.L.S | E.L.S Edge |
| 36,147 | 20,453 | 0.00 | -351.91 | 21 (1) | 11 (1) | N/A | N/A |
| Strike Rate | ROI | Min Place BSP | Max Place BSP | Avg Place BSP | Avg BSP | Chi Score | A/E |
| 56.58% | -0.97% | 1.10 | 5.89 | 1.77 | 1.94 | N/A | N/A |
Next, I will look at the breakdown of my results.
This highlights any areas where the system has excelled, which I can then potentially use to add further rules to narrow down the selection process.
Results breakdown to 1 point per bet:
By Year
By Month
By Day
This is particularly useful for systems such as this with a large volume of bets.
For example, one area that requires further investigation with this system is the ‘Horse Distance Winners’.
You can see below that horses with zero or one win at today’s distance have lost over 300 points to BSP, while those with two or more wins have produced 502.49 points profit.
If I add this rule and run the system again, you can see the system has now produced 319.26 points profit at an ROI of 3.98%. The bets have been reduced dramatically to just shy of 8,000.
| Win Bets | Wins | P/L SP | P/L BSP | Win Streak | Lose Streak | E.L.S | E.L.S Edge |
| 7,999 | 1,935 | -411.75 | 319.26 | 7 (1) | 25 (1) | 32.45 | 22.96% |
| Strike Rate | ROI | Min Win BSP | Max Win BSP | Avg Win BSP | Avg BSP | Chi Score | A/E |
| 24.19% | 3.99% | 1.03 | 10.00 | 4.37 | 5.37 | 3.61 | 1.04 |
| Place Bets | Places | P/L SP | P/L BSP | Place Streak | Lose Streak | E.L.S | E.L.S Edge |
| 7,999 | 4,116 | 0.00 | -80.49 | 13 (1) | 14 (1) | N/A | N/A |
| Strike Rate | ROI | Min Place BSP | Max Place BSP | Avg Place BSP | Avg BSP | Chi Score | A/E |
| 51.46% | -1.01% | 1.05 | 5.89 | 1.94 | 2.10 | N/A | N/A |
Another area of interest from my initial system is ‘Days Since Last Run’. There is a clear trend here favouring horses who have run in the past 31 days.
Let’s adjust the rules again and see how the improved system has performed:
| Win Bets | Wins | P/L SP | P/L BSP | Win Streak | Lose Streak | E.L.S | E.L.S Edge |
| 6,032 | 1,465 | -147.18 | 408.04 | 5 (1) | 25 (1) | 31.29 | 20.10% |
| Strike Rate | ROI | Min Win BSP | Max Win BSP | Avg Win BSP | Avg BSP | Chi Score | A/E |
| 24.29% | 6.76% | 1.03 | 10.00 | 4.47 | 5.40 | 6.60 | 1.06 |
| Place Bets | Places | P/L SP | P/L BSP | Place Streak | Lose Streak | E.L.S | E.L.S Edge |
| 6,032 | 3,162 | 0.00 | 79.77 | 11 (1) | 13 (1) | N/A | N/A |
| Strike Rate | ROI | Min Place BSP | Max Place BSP | Avg Place BSP | Avg BSP | Chi Score | A/E |
| 52.42% | 1.32% | 1.05 | 5.89 | 1.95 | 2.09 | N/A | N/A |
Of course, these are historical results rather than a forward test. Because I used the results breakdown itself to help choose additional filters, the improved figures need to be treated with caution until the system has been tested on future races.
We have now reduced the number of bets by over 30,000 from our initial system whilst seeing the ROI jump from 0.56% to 6.76%, and also producing a small profit in the place market.
For clarity, here are the final rules of this test system:
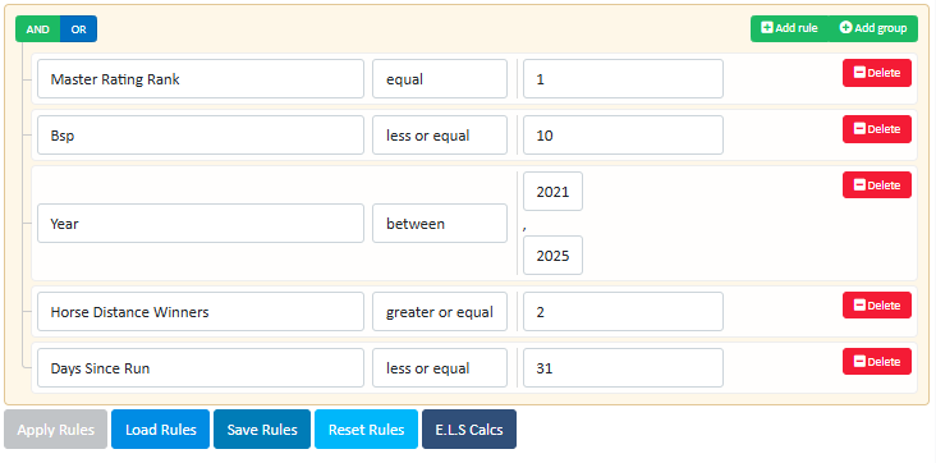
Avoiding Overfitting
This shows the power of the Inform Racing system builder, as using logical filters combined with their ratings can produce promising systems.
The important thing is to not overfit a system with too many rules in search of the perfect system, particularly if there is no logical reason for the rules you have picked.
For example, my ROI could be improved considerably if I focused only on Saturday races, or races held over exactly 6 furlongs, or races only in the month of August. But there does not appear to be any logical reason for those filters to improve results, so it is most likely due to variance or a small sample size.
You can export the full results history of any system to excel to conduct further analysis.
Additionally, you can export the upcoming selections (2-3 days) of all saved systems to have all your upcoming bets in one place.
Final Verdict
Inform Racing earns an Approved rating from me.
What impressed me most is the combination of a proven daily tips service and a genuinely useful set of research tools. Those who simply want selections to follow can use the Daily Tips, while more hands-on bettors have plenty to work with through the Race Cards, speed ratings and System Builder.
The Daily Tips have produced particularly strong historical results to BSP, while the System Builder offers enough depth to test ideas properly rather than simply relying on headline statistics.
As always, historical results are no guarantee of future performance, but Inform Racing is one of the more comprehensive horse racing services I’ve reviewed.
APPROVED
Get Started
£1 for 7 Day Trial
Get 7 days of access to the Daily Tips, Race Cards and System Builder.